Bitcoin Wave Analysis: Bullish Breakout Targets $120,000
Bitcoin (BTC), the world’s leading cryptocurrency, has once again captured the attention of traders and investors. After consolidating within a symmetrical triangle formation for weeks, Bitcoin finally broke out of this structure, confirming renewed bullish momentum. This breakout, which began forming in early August, has strengthened Bitcoin’s technical outlook and has set the stage for a possible climb toward $120,000.
In this article, we’ll analyze Bitcoin’s latest price action using Elliott Wave theory, discuss the breakout from the daily triangle pattern, evaluate key resistance levels, and highlight the broader implications for the crypto market. Whether you’re a long-term investor or a short-term trader, understanding these dynamics can help you align with the current market trend.
Understanding the Triangle Breakout
A triangle pattern often signals a phase of market indecision. Price contracts within narrowing support and resistance levels, suggesting that buyers and sellers are in a temporary stalemate. However, when the triangle breaks, it typically unleashes strong momentum in the direction of the breakout.
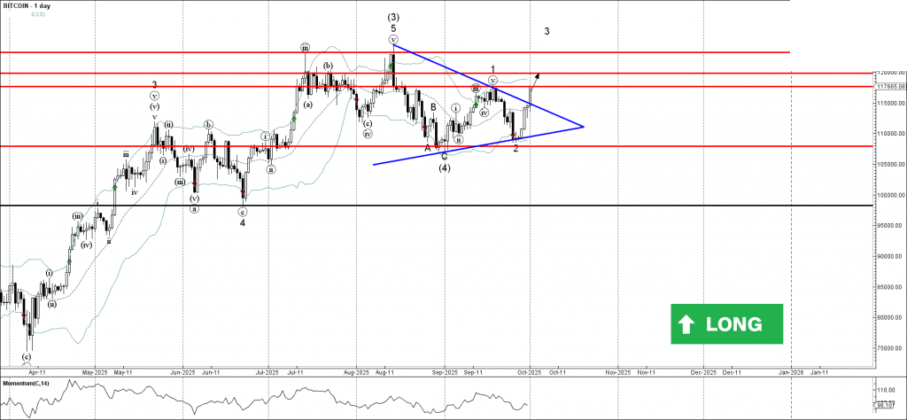
Bitcoin’s recent breakout confirms that the bulls have regained control after months of sideways movement. Since early August, BTC consolidated within this triangle, creating a coiling effect in volatility. By the end of September, momentum favored the upside, breaking the upper boundary of the pattern and confirming a bullish continuation.
This breakout coincides with the development of wave 3 of intermediate wave (5) within the Elliott Wave framework. In Elliott Wave analysis, wave 3 is typically the strongest and most impulsive, meaning it often delivers significant price expansion.
Elliott Wave Structure: Why Wave 3 Matters
Elliott Wave theory is a widely used technical framework in financial markets. It suggests that prices move in recognizable cycles of five waves in the direction of the trend (impulse waves) and three corrective waves (retracements).
Currently, Bitcoin is unfolding in the intermediate impulse wave (5). Within this wave, the breakout has triggered a short-term impulse wave 3. Historically, wave 3 tends to be the most powerful leg of the Elliott sequence, often characterized by:
1. Strong momentum and high trading volume
2. Wide candlesticks on daily charts
3. Minimal retracements during the move
4. Sharp increases in investor interest
For Bitcoin, this means that the breakout above the triangle is not just a routine move, it’s part of a potentially explosive phase in its Elliott Wave cycle.
Key Resistance Levels Ahead
Even though Bitcoin has confirmed a breakout, the market never moves in a straight line. Traders must pay attention to resistance zones that may act as hurdles before higher targets are achieved.
1. Immediate Resistance: $117,570
This is the first key resistance level to watch. A decisive daily close above this point would add further validation to the bullish scenario. Without this breakout, Bitcoin may remain choppy in the short term.
2. Round Number Resistance: $120,000
Psychological levels, particularly round numbers, tend to attract strong market activity. $120,000 is a major psychological milestone and will likely bring profit-taking and temporary resistance. If Bitcoin conquers this level, it could open the door for even higher targets.
Broader Market Sentiment
The breakout comes at a time when broader sentiment around cryptocurrencies has improved. Several factors are contributing to this renewed optimism:
- 1. Institutional interest: More hedge funds and investment firms are re-entering the crypto space.
- 2. Macro environment: Slowing inflation data and favorable liquidity conditions are supporting risk assets.
- 3. ETF adoption: Bitcoin exchange-traded funds (ETFs) are gaining popularity, further fueling demand.
- 4. On-chain strength: Active addresses, exchange outflows, and declining supply on exchanges suggest holders are expecting higher prices.
When technical analysis aligns with strong fundamentals, the conviction of a bullish move becomes even stronger.
Why This Breakout is Different
Bitcoin has seen many triangle patterns and breakouts in its history, but this one is particularly significant for several reasons:
1. Prolonged Consolidation – The longer the consolidation, the stronger the breakout. Bitcoin’s sideways action since August created a large base of accumulation.
2. Wave Alignment – The breakout coincides with wave 3 of (5), which historically delivers the steepest gains.
3. Macro Tailwinds – Unlike in bearish years, Bitcoin is now supported by institutional demand and improving risk sentiment.
4. Momentum Confirmation – Oscillators like RSI and momentum indicators confirm a bullish trend continuation.
Trading Strategy for Bitcoin Investors
While no forecast is ever guaranteed, traders can develop strategies around the current setup.
Short-Term Strategy
- - Entry: On retracements toward $114,000–$115,000 support zones
- - Target: $117,570 followed by $120,000
- - Stop-loss: Below $111,000 to protect against a false breakout
Medium-Term Strategy
- Hold existing long positions as long as BTC trades above the triangle breakout zone.
- Trail stop-losses upward to lock in profits as price advances.
Long-Term Strategy
- Long-term holders should remain patient. Wave 3 rallies often extend further than expected, and $120,000 may only be an intermediate milestone before even higher levels are achieved.
Risks to Consider
Despite the bullish breakout, traders should remain cautious of potential risks:
- 1. False Breakouts: Crypto markets are volatile. If Bitcoin fails to sustain above $117,570, it may dip back into consolidation.
- 2. Regulatory Shocks: Sudden regulatory crackdowns could dampen sentiment.
- 3. Macroeconomic Uncertainty: A resurgence of global inflation or tighter monetary policy could weigh on risk assets.
Always manage risk with proper position sizing and stop-losses.
Long-Term Implications
If Bitcoin successfully breaks above $120,000, it will mark another major milestone in its adoption journey. Beyond price speculation, such moves attract mainstream attention and further institutional involvement. Historically, each breakout to a new milestone has accelerated Bitcoin’s network growth, media coverage, and mainstream acceptance.
This rally could set the stage for even higher long-term targets, possibly pushing Bitcoin closer to $150,000–$180,000 in future wave extensions.
Conclusion
Bitcoin’s breakout from the daily triangle pattern has reignited bullish momentum. As wave 3 of (5) unfolds, technicals point to higher prices, with $117,570 and $120,000 as critical resistance levels. Given the strong uptrend, traders and investors should watch for confirmation above these levels while managing risk carefully.
This wave cycle reinforces Bitcoin’s role as both a speculative asset and a long-term store of value. While volatility remains part of the journey, the larger trend suggests Bitcoin is entering another powerful phase of growth.
Frequently Asked Questions (FAQ)
1. What does Bitcoin’s breakout from the daily triangle mean?
It signals the end of a consolidation period and the beginning of a new bullish impulse wave. The breakout indicates strong upward momentum, likely to push BTC toward higher resistance levels.
2. Why is the resistance level at $117,570 important?
This level represents a nearby technical barrier. If Bitcoin breaks and holds above it, the path toward the psychological $120,000 level becomes clearer.
3. How does Elliott Wave theory apply here?
Bitcoin is currently in wave 3 of intermediate wave (5). Wave 3 is usually the most powerful and impulsive, often leading to significant price gains.
4. Is Bitcoin expected to reach $120,000 soon?
If Bitcoin sustains its momentum above $117,570, it has a strong chance of testing $120,000 in the near term. However, markets are volatile, and proper risk management is essential.
5. Should traders buy Bitcoin now?
Buying opportunities exist on pullbacks toward support zones, but traders should place stop-losses below key levels to protect against false breakouts. Long-term investors may continue to hold as the macro trend remains bullish.